How I squeezed a BERT sentiment analyzer into 1GB RAM on a $5 VPS
I’ve always been bothered by the inefficiency of modern AI deployment. Everyone seems to be renting massive GPU clusters just to classify text. As a Systems Engineer, I wanted to see if I could go the other direction: How much signal can I extract from the cheapest possible hardware?
I set a challenge for myself: Build a real-time financial sentiment analyzer for global markets (US, EU, MENA) that runs entirely on a single-core, 1GB RAM VPS without crashing.
The result is TrendScope. Here is the engineering breakdown of how I handled the memory constraints.
The Constraint: 1GB RAM vs. Modern NLP
A standard bert-base-uncased model with PyTorch consumes ~400-600MB just to load, and inference spikes memory usage well beyond 1GB, leading to immediate OOM kills on a small instance. To make this work, I had to treat the model as a software dependency that needed aggressive optimization, not a black box.
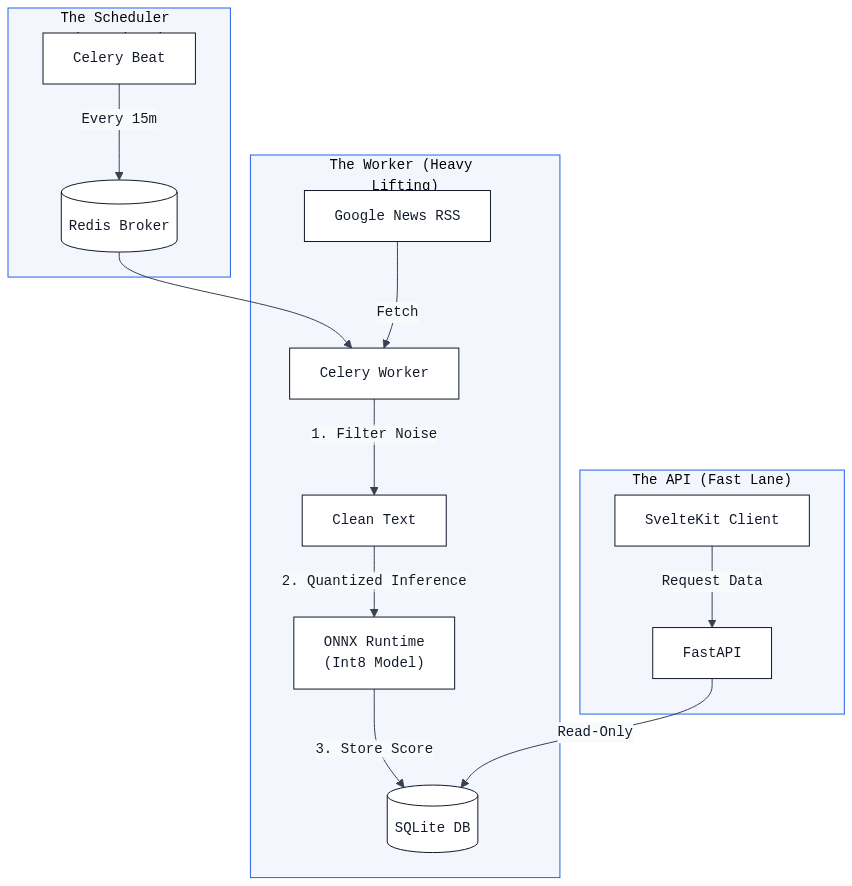
Figure 1: The TrendScope architecture, showing the decoupled data flow: Cron-triggered ingestion, queue-based processing with Celery, low-latency ONNX inference, and realtime SvelteKit visualization.
1. The Model Stack (Distillation + Quantization)
I started with FinancialBERT, a model pre-trained on financial text. To fit it into my RAM budget, I ditched PyTorch for inference entirely.
- Distillation: I didn’t need generative capabilities, just classification (Bullish/Bearish/Neutral).
- Quantization (The Real Fix): I converted the model weights from FP32 (32-bit floating point) to Int8 using the ONNX Runtime’s dynamic quantization.
The Numbers:
- Tooling:
optimum-cliandonnxruntime - Storage: Model weights dropped by ~4x (from ~440MB to ~110MB).
- RAM: Peak memory usage reduced from >1GB (PyTorch) to ~570MB (ONNX).
- Performance: Inference latency is sub-50ms on a CPU.
This optimization changed the economics completely. The entire stack (Backend, Frontend, Redis) idles at ~200MB of RAM. when the scheduled job triggers, the worker spikes to ~570MB to load the Quantized model, runs the inference, and then releases the memory. This fits safely within a 1GB footprint, whereas a standard PyTorch deployment would execute an immediate OOM kill.
2. The Architecture: Celery with Strict Memory Limits
The application uses FastAPI for the frontend API and Celery (with Redis) for the background workers.
The biggest risk was memory fragmentation. Python processes often hold onto memory even after a task finishes. To prevent the worker from slowly eating up the remaining 700MB of RAM, I used a specific Celery configuration:
# Force the worker to restart after every single task to release memory
celery_worker_args = {
    "max_tasks_per_child": 1,
    "concurrency": 1
}
This ensures that the “heavy” inference process dies immediately after processing a batch of headlines, returning 100% of the RAM to the OS.
3. The Pipeline
- Ingest: Every 15 minutes, the system pulls RSS feeds for 7 distinct regions (Global, US, EU, Egypt, Saudi Arabia, etc.).
- Filter: A lightweight heuristic filter drops “fluff” (podcasts, opinion pieces) before they hit the expensive model.
- Inference: The ONNX runtime scores the remaining headlines.
- Visualize: The frontend is built with SvelteKit and Tailwind v4. It visualizes the “Sentiment Balance” (Bullish vs. Bearish) and calculates a 24-hour trend line to show momentum.
Why This Matters
We are entering an era where “Efficient AI” is becoming more critical than “Massive AI.” By applying standard systems engineering principles—quantization, worker recycling, and efficient runtimes—I managed to build a tool that digests the global economy every 15 minutes for the price of a cup of coffee.
Live Demo: https://trendscope.akamaar.dev/ Source Code: GitHub Repository
If you have questions about the ONNX export process or the specific quantize_dynamic settings I used, happy to answer them in the comments!